Where Will It Grow
Gerald “Stinger” Guala, Ph.D., Former Keeper of the Herbarium
A predtcted range map for Apoclada arerucola McClure in Brazil from an article recently published in Bamboo Science and Culture (Vol. 14: 21-27). The white dots are actual populations of the species. The darker the area, the higher probablility of growth.
Everyone who has had a fascination with exotic plants knows that you cannot predict if a given species from some exotic location will live or die in your back yard. However, with new technology, we can now make more accurate predictions than ever before. Much of my research deals with the evolution of species over time and how they move from one specific environment to another. This means that I have to know the specific individual environment or niche in which each species grows. To get that information, I usually borrow the known herbarium specimens for a given species and then map the location where each was found in a computer mapping database called a Geographic Information System (GIS).
The satellite age has given us a lot of environmental data for the whole world. We now have very accurate knowledge of the average daily, monthly and annual rainfall, temperature, cloudiness and albedo (the reflectivity of the surface) for every place on earth. Using these data, the several wavelengths of light that satellites constantly measure, and large data sets of measurements taken on the ground, we can predict, or model, environmental characteristics such as humidity, fire potential, soil type, specific soil characteristics (such as structure and water holding capacity), vegetation type and many specific vegetation characteristics. These data allow us to make very accurate predictions about where a species will grow based on where it already grows.
There are several statistical methods of putting these data into a GIS and coming up with a set of probabilities that a specific plant will grow on any location. Some of the methods are extremely sophisticated and complex. The most complex ones require the kind of giant supercomputers that the national weather service uses to predict the weather. Other programs are less complex and can run on a little palmtop computer.
Despite the interest in whether or not you can cultivate a plant, it is more important for me to know where it will grow on its own and why. Although I often use the complex methods to answer specific questions about individual species, the method that I use most often is actually very simple. Imagine a map with a very fine grid on it, with each cell in the grid having a value for whatever the map is showing, e.g. average millimeters of rainfall in January. The grid cell that includes Fairchild Tropical Botanic Garden might have a value of 58 mm. Now imagine that there are many map layers, one for rainfall in every month, one for temperature in every month and so on. That is what the GIS looks like. I can take all of the map cells for the entire area in which a species grows and get the range of values in them (e.g. 45 - 60 mm of rainfall in January) and then make another map layer that has a value of 1 in every cell on earth that had a value between 45 and 60 mm and a zero in every other cell. I can make many of these layers, one for each variable I am looking at, (in this example, 100), overlay them and odd up the values for each cell on the map. Thus, every cell where the species actually has been found growing will have a value of 100. Some other cells will have a value of 100 as well: these are clearly the ones that have the highest probability for the survival of the species.
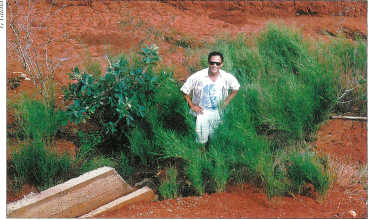
Dr. Tarciso Filgueiras stands in a clump of Apoclada arenicola.
The interesting cells to me are those that have values of nearly 100, because with this simple system I can track exactly which variable is out of the range for the species. For example, a cell (e.g. the one that includes Key West) has a value of 99. I am able to determine that all layers have a value of 1 for that cell - except for the January rainfall layer. Since the January rainfall was only 43 mm and the species is only known from areas that have 45.60 mm in January, that cell got a value of zero when I converted the map to 1s and Os. This information allows me to say that it is likely that the species will grow in Key West but that it may need to be watered a bit in January.
In practice, I can generate a map using only a few variables that will provide a realistic view of where a species will grow. The variables I would use differ by region, but generally include the coldest and driest months in the growing season. You can see from the map above that a very good prediction of the range can be produced from just a few variables.
With the right data, a simple technique, and a lot of data entry, we can now predict where a species will grow and we can get a good idea why it won't grow in other areas. However, you can see in the photo below that even the best methods have their problems. Dr. Tarciso Filgueiras, a Brazilian grass expert and valued colleague (pictured), and I found this population of Apoclada arenicola growing in an area of western Brazil where (based on preliminary analyses) it should not have been growing because of low rainfall. See if you can guess how it survived.
Garden Views Winter 2002