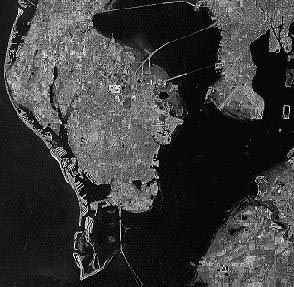
Produced by ERIM, this Landsat
Thematic Mapper image of Tampa, Florida, is shown in TM Bands 7,4,3 (RBG).
Circa 1975.
G.F. Guala
GPS
Biogeography is based on distributions. Global Positioning Systems (GPS) use satellite positions and the time that it takes a signal to pass between them and a receiver as a measure of distance to geometrically traingulate their own postion on earth. Inexpensive handheld GPS receivers are generally accurate to 20m, heavier and much more expensive differential units can be accurate down to a cm or two.
TRIMBLE GPS SITE: A very good explanation of how a GPS.
You will see examples of different types of GPS units in class.
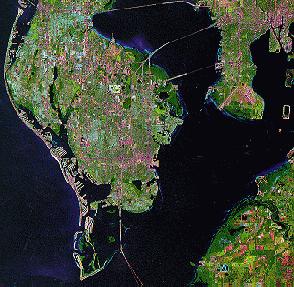
Produced by ERIM, this Landsat
Thematic Mapper image of Tampa, Florida, is shown in TM Bands 7,4,3 (RBG).
Circa 1975.
A brief but complete history and overview of the types of data gathered
is provided here.
USGS
Geospatial Data Clearinghouse
The Thematic Mapper and Multisensor bands vary in their usefulness to biogeographers. Below are two quotes from the USGS site.
"The identification of features is provided
by the distinct electromagnetic energy it emits, reflects, or otherwise
transmits. This is called the spectral
signature. Other signatures are
tone (lightnes or darkness), texture (surface roughness or smoothness),
pattern, shadow, shape and size are as important.Thus,
through the use of thematic mapper,
such elements as water features, soils, and vegetation can be identified
and distinguished from each other."
"These Landsat satellites have provided repetitive, synoptic, global coverage of high-resolution multispectral imagery. The characteristics of the MSS and TM bands were selected to maximize their capabilities for detecting and monitoring different types of Earth resources. For example, TM band 2 can detect green reflectance from healthy vegetation, and band 3 of TM is designed for detecting chlorophyll absorption in vegetation. TM band 4 is ideal for near-IR reflectance peaks in healthy green vegetation and for detecting water-land interfaces. TM band 1 can penetrate water for bathymetric mapping along coastal areas and is useful for soil-vegetation differentiation and for distinguishing forest types. The two mid-IR red bands on TM (bands 5 and 7) are useful for vegetation and soil moisture studies, and discriminating between rock and mineral types. The thermal-IR band on TM (band 6) is designed to assist in thermal mapping, and for soil moisture and vegetation studies. Typically, TM Bands 4, 3, and 2 can be combined to make false-color composite images where band 4 represents red, band 3, green, and band 2, blue. This band combination makes vegetation appear as shades of red, brighter reds indicating more vigorously growing vegetation. Soils with no or sparse vegetation will range from white (sands) to greens or browns depending on moisture and organic matter content. Water bodies will appear blue. Deep, clear water will be dark blue to black in color, while sediment-laden or shallow waters will appear lighter in color. Urban areas will appear blue-gray in color. Clouds and snow will be bright white. They are usually distinguishable from each other by the shadows associated with the clouds."Other Types of Satellite Data are available from
and at the
The really nifty things about satellite data are:
1. You can get nearly whole earth coverage.
2. You can get multiple coverages over time.
3. There are multiple bands of information.
3. The information is digital so you can combine it and model with
it.
4. The potential for extrapolation is enormous... and frightening.